Technical Analysis

The foundation of technical analysis is built on the belief that price action and historical trading activity of financial securities are valuable indicators of future price movement. Detection of cyclical patterns in the past can help locate future trading opportunities.

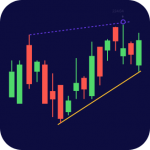
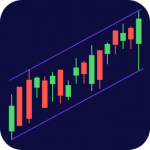
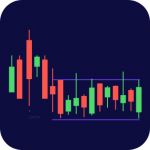
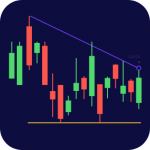
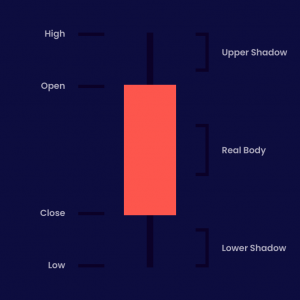
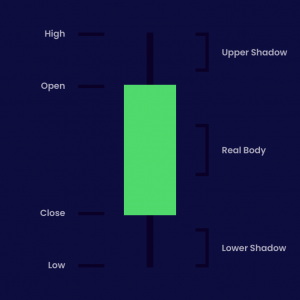
Technical traders use statistical charts for analyzing price movements. By looking for trends and patterns, the analysts strive to comprehend the market sentiment attached to price trends. Luccro tools analyze the price action using Japanese candlestick charting techniques. Numerous popular candlestick patterns have been defined in reference texts and what they indicate by their presence. Some of the basic patterns and additional more complex patterns are explained below as part of trader education. These patterns are automatically detected using pattern analysis within the Luccro platform.

Trend Lines

Trend lines help to indicate and confirm trends. On a chart, a trend line connects two price points and is extended further to indicate sloped zones of resistance and support. Chartists use support and resistance levels to indicate price points on charts. Support is when a downtrend pauses because of demand concentration; while resistance is when an uptrend pauses temporarily because of supply concentration.

  • Consolidation Patterns
  • Candlestick Pattern

Consolidation patterns describes the movement of a price (price oscillation) within a geometrical range. It is generally considered as a time of indecision and the price moves sideways during this period, confined by a resistance line and a support line. Hitting one of these lines causes reversal of price action as long as the pattern holds. This indecision stops when the price breaks out past one of the two confining lines. The different consolidation patterns are shown below.

Wedges

Wedges

Wedges resemble triangles to a degree but both the support and resistance lines slant up or down at an angle. One of these lines carrier a sharper slope than the other, causing a narrowing price action.

Channels

Channels

Channel occurs when the price of a security moves between two parallel trend lines. Hence, it can be considered as a special case of the wedge pattern where both lines exhibit the same angle of slope. This pattern occurs quite frequently and can become a self fulfilling prophecy of price action.

Flags

Flags

After a powerful movement, prices usually tries to take a pause. This period usually happens in the form of a rectangle or flag. The price moves between two horizontal support and resistance lines. Most flags become continuation patterns of previous movement, with the price breaking out in the same direction from which it originally entered the flag.

Triangles

Triangles

A triangle pattern is a popular consolidation pattern where the price action keeps narrowing, providing it the shape of a triangle. This narrowing occurs between a support and a resistance line. Triangles are further classified as Ascending, Descending and Symmetric triangles. An Ascending triangle shows price action between a rising support line and a horizontal resistance line. A Descending triangle uses a horizontal support line and a falling resistance line. A Symmetric triangle’s price action is confined between a rising support and a falling resistance line, causing it to narrow quickly.

A candlestick represents the market’s High, Open, Low, and Close price for a specified period, that could be a week, a day or an hour (among other time frames). It usually contains two wicks on either end and a significant part known as the “Real Body.”

The Appearance of a Candlestick

The look of a candlestick is determined by the period’s low, high, open, and close. Candlestick charts have thicker real bodies and are very visual. Real bodies can be red or green, long or short – all depending upon the market price. The real body of a candlestick shows the open and close price range for a day.

Candlestick red

If the closing price is below the open price, the candle has a red body. If the price closes higher than the open price, it leads to a green body. In rare cases, the open and close price might be the same, leading to no body at all. Such a candle is indicative of market indecision.

Canlestick Green

The real body is usually attached to ‘wicks’ or ‘shadows’ at both top and bottom. The shadows indicate the low and high rates of the period. When the upper wick of a down candle is short, it shows the open was near the high for the day. A short upper shadow of a green candlestick indicates that the close was just below the high.

tweezer top

Tweezer Top

Tweezer top pattern involves two candles with the same high point. This type of height indicates that the uptrend will either reverse or pause.

Tweezer Bottom

Tweezer Bottom

The reverse of a Tweezer top, Tweezer bottom occurs at a support line and is a reversal pattern. The candle sizes or colors are not too important. The two candles have the same low point and a similar shape.

hammer

Hammer

A hammer is a single candle based reversal pattern. Hammers have small real bodies with a long lower shadow. They occur after a downtrend and indicate a potential price reversal to the upside. Following a hammer, prices are expected to start moving up again.

shooting star

Shooting Star

A bearish candlestick with a long upper shadow and a small body is called a Shooting Star. Essentially, it is the opposite of the Hammer pattern. The lower wicks are usually small or non-existent. It is a reversal pattern occurring after an uptrend and signal the possible start of a downtrend.

Bitnami